Data Scientists often find themselves repeating the mantra “Correlation is not causation.” It’s a good thing to remind our stakeholders — and ourselves — constantly because data can be treacherous, and because the human mind can’t help but interpret statistical evidence causally. But perhaps this is a feature, and not a bug: we instinctively seek the causal interpretation because it is ultimately what we need to make correct decisions. Without causal stories behind them, correlations are not particularly helpful for decision-makers.
But ultimately, all we can read off of data are correlations and it is very challenging to ensure that the causal story we are attaching to these correlations are actually true. And there are several ways we could get the causal story wrong. The most common mistake is failing to account for common causes or confounders. Using the canonical example, there is a positive correlation between hospitalization and death. In other words, people who are hospitalized are more likely to die than those who are not. If we ignore the fact that being sick can cause both hospitalization and death, we might end up with the wrong causal story: hospitals kill.
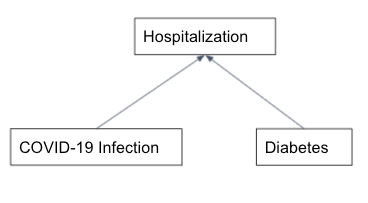
The other common pitfall arises when we take the lessons from the confounders too far and account for common effects or colliders. The example here is adapted from the description of the Berkson’s Paradox in the Book of Why by Pearl and Mackenzie. Suppose that we are trying to see if COVID-19 infections can induce diabetes. Let’s say, in reality, there is no such causal link but a diabetic patient is more likely to be hospitalized if they get infected with the virus. Now, in our zeal for accounting for any potential confounders, we decided to limit our study to hospitalized folks only. This could lead us to observe a correlation between COVID-19 and diabetes even in absence of any direct causal link. And if we are even less careful, we might spin a yarn about how COVID causes diabetes.

If we only look at the hospitalized population, we might observe a correlation between COVID-19 and diabetes even in absence of any direct causal link and incorrectly infer that COVID-19 causes diabetes.
Another way in which causal stories go wrong is when we account for mediators. Continuing with the morbid theme of this blog post so far, let’s say we are studying if smoking can actually cause early death. If we account/adjust/control for all the ways (lung cancer, heart diseases) smoking can lead to death, then we may find little to no correlation between smoking and death even though smoking does in fact increase mortality.
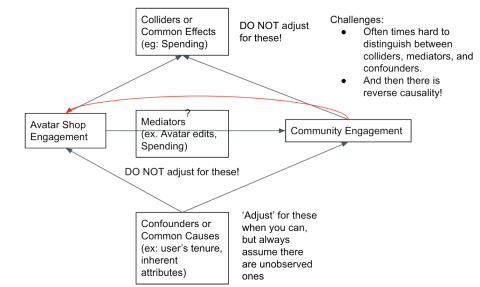
“So, what’s so hard about this!?” You might say. “Just adjust for the confounders and leave out colliders and mediators!” Causal inference is hard because, first, we most likely never have data for all the possible confounders. And second, it is often hard to distinguish between colliders, mediators, and confounders. And sometimes causality runs in both directions and it becomes almost impossible to parse out these bidirectional effects.
A Roblox Example
So, how do we get around these real challenges? The more reliable solution, especially in tech, is experimentation or A/B testing. However, this is not always feasible. By now you must have had enough with morbid examples, so let’s use a fun one. On Roblox, our users express their identity and creativity through their Avatar, by donning themselves with different items they can acquire on the Avatar Shop.

My Avatar
As you can imagine, maintaining the health of this feature is very important to us. In order to figure out how many resources we invest in this marketplace, we would want to know how much it ultimately contributes to our company’s goals. More specifically, we want to estimate the impact Avatar Shop has on community engagement. Unfortunately, a direct experiment is not feasible.
- We cannot just turn Avatar Shop off for a portion of our user population because it is a really important part of the user experience on our platform.
- Avatar Shop is a marketplace where users interact with each other as buyers and sellers. Turning it off for one set of users also impacts users for whom it was not turned off.
Meanwhile, estimating this causal relationship using non-experimental data is a treacherous path because (i) we have identified several confounders that are either not cleanly adjustable or not observable, and because (ii) we have found that movements in our topline metrics also have a reverse impact on engagement with the Shop.

Why causal inference is hard.
This is not an uncommon problem and there are several statistical methodologies that might be useful. For example, a Differences-in-Differences or Two-Way Fixed Effects (TWFE) estimations would track a set of users over time and see how their hours engaged changed after engaging with the Avatar Shop. Another popular technique is the Propensity Score Matching (PSM), which attempts to match users who use the Avatar Shop with those who did not based on various factors. These methods have their own unique advantages and challenges, but often suffer from the same fatal flaw even when implemented correctly: unobserved factors that can influence both engagement with the Avatar Shop and hours engaged, i.e., confounders. (Side note: Differences-in-Differences is expected to be robust against fixed confounders, but is still vulnerable against confounders that change with time).
Instrumental Variables to the Rescue

Instrumental Variables can provide a solution for unobserved confounders that other causal inference techniques cannot. The emphasis is on “can” here, because the hardest part is finding that special variable that satisfies the two main conditions for a valid IV estimation:
- First Stage: It needs to be strongly associated with the variable of interest (Avatar Shop engagement, in our case).
- Exclusion: Its only association with the outcome (hours engaged) is via the variable of interest (Avatar Shop engagement).
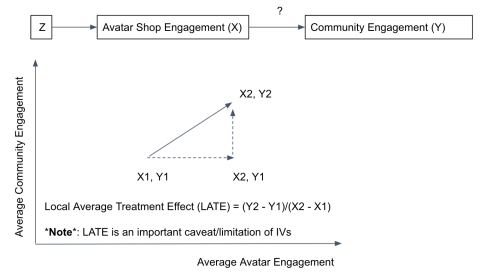
If we can identify such an instrument, our causal estimation using non-experimental data becomes a lot simpler: any variation in the outcome (Y) correlated with the variation of the variable of interest (X) explained by the instrument (Z) is a causal impact of X on Y. See the diagram for a simplified example of the basic idea behind instrumental variables.

Z predicts the movement in average Avatar Shop engagement from X1 to X2. And, as a result, average hours engaged increases from Y1 to Y2. Then, the slope is a causal estimate of the X -> Y relationship.
The diagram above also indicates how crucial the two conditions are. First, the instrument has to strongly predict the movement from X1 to X2. And secondly, we are sort of taking a leap-of-faith here that the movement from Y2 to Y1 was entirely due to the X1 to X2 movement. If Z has a way of influencing Y other than via X, then we will be incorrectly attributing all of the movement in Y to X.
As you can tell, the second condition is where IV estimations fail most often because it is quite a strong claim to make in a complex system. So, what exactly is the instrument in our case and why are we confident at all that it satisfies the second condition?
Our instrument
About a year ago, we ran an A/B test to evaluate our new ‘Recommended For You’ feature for the Avatar Shop. We had observed a huge impact on Avatar Shop engagement. In other words, which experimental group a user belonged to strongly predicted their engagement with the Avatar shop (First Stage). We also observed the impact in the hours engaged. And because this experiment was designed specifically to evaluate a change in the Avatar Shop and did not touch anything else on Roblox, we have strong reasons to believe that any changes in the hours engaged must have been only due to changes in Shop engagement (Exclusion).

Our recommendations experiment serves as a good instrument because it had a strong impact (F-stat > 15000) on shop engagement and we have no reasons to believe that it could have influenced hours engaged via any other path.
Having a good instrument means that we can estimate the causal link from Avatar Shop engagement to hours engaged without having to turn off Avatar Shop to some of our users, as a direct A/B test.
Findings
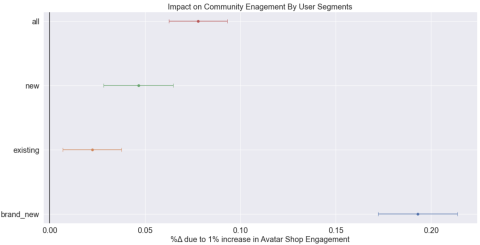
Using the IV estimation as outlined above, we find a statistically significant and positive causal relationship between our two variables. Specifically, 1% increase in Avatar Shop Engagement results in 0.08% (SE: 0.008%, p-value < 0.000) increase in experience time. Diving a little deeper by running the same analysis on users segmented by how long they have been on Roblox, we observe something interesting: these impact estimates are not homogeneous. In particular, we notice that Shop engagement has a much stronger impact on experience time for brand new users (signed up less than a week ago).

We estimate that Avatar Shop engagement has a much stronger impact on community engagement for our newest users.
This is a really useful insight that can help us design an onboarding experience for our newest users. It is also a good opportunity to discuss an important limitation of IVs: they estimate Local Average Treatment Effects (LATE) rather than Average Treatment Effects (ATE) like a direct experiment would. That is, these estimates are specific to users whose behavior were impacted by our instrument, and therefore may not necessarily be generalizable to the overall population. And this distinction is relevant whenever we think treatment effects are not homogenous, like we see above. In practice, it is always safe to assume that the treatment effect is heterogeneous and therefore IV estimates, even when they are internally valid, are not perfect substitutes for experiments. But sometimes they might be all we can do.
Next Steps
One antidote to the LATE problem of IVs is actually to find more instruments and estimate a bunch of LATEs. And the goal there is to be able to construct the global average treatment effect estimate by combining a series of local effect estimates. That is precisely what we plan to do next and we can do it because we run a wide range of experiments on different sides of the Avatar shop. Each one should serve as a valid instrument for our purposes. As you can imagine, there are a lot of cool, challenging analytics problems to be solved. And if those are your cup of tea, we would love for you to join Roblox’s Data Science and Analytics team.
Last Thoughts About Instrumental Variables
We hope this love-note and introduction to the Instrumental Variables exhibits its power and sparks your further interest. While this causal estimation method might have been overused in certain settings, we think it is criminally underused in tech, where its assumptions are much more likely to hold, especially when the instrument comes from an experiment. Further good news is that because it has been around since the 1920s!, there is a rich literature with active lively discussions about its proper implementation and interpretations.
— — —
Ujwal Kharel is a Senior Data Scientist at Roblox. He works on the Avatar Shop to ensure its economy is healthy and thriving.
Neither Roblox Corporation nor this blog endorses or supports any company or service. Also, no guarantees or promises are made regarding the accuracy, reliability or completeness of the information contained in this blog.
©2021 Roblox Corporation. Roblox, the Roblox logo and Powering Imagination are among our registered and unregistered trademarks in the U.S. and other countries.
The post Causal Inference Using Instrumental Variables appeared first on Roblox Blog.


